Live values
Gauge, Digital, Level, Boolean and Battery widgets show the current state at a glance.
- Battery widget with discharge curves for LiPo, LiFePO4, LiMnO2 and alkaline cells
- Boolean widget for door, leak and occupancy states
Design a dashboard once per device model and every device gets it automatically. Combine many devices on site dashboards with floor plans, maps and charts. Give operators, managers and customers exactly the view they need.

Network server consoles show payloads and frame counters. Spreadsheets show yesterday. Building a custom web dashboard for each project takes weeks, and every new device model starts the work again. Meanwhile the facility manager just wants to know which room is too warm.
Add widgets to an asset template. Every device of that model, today and in the future, shows the same dashboard with its own data. A ready template from the device repository usually includes one.
Combine any devices on one screen: a building on a floor plan, a fleet on a map, a table of all freezers. Pin the most important one as your home screen.
Downlink buttons send commands to devices, event widgets show what just happened, and every widget links back to the device for history and settings.
All widgets are configured in forms: choose a device, a data field and a style. No front-end development needed.
Gauge, Digital, Level, Boolean and Battery widgets show the current state at a glance.
Line and bar charts with time aggregation, log charts for event-style data, and scatter plots to see how two values relate.
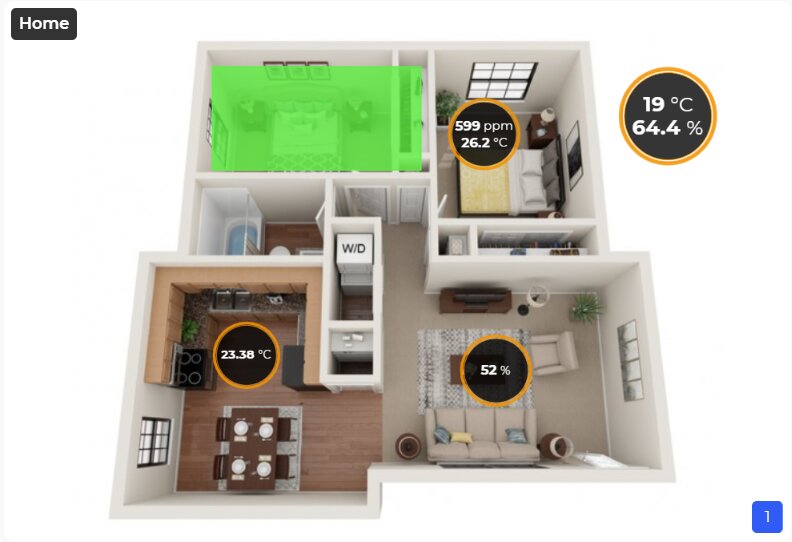
Upload a floor plan, machine drawing or 3D render and place live values and coloured status zones on it. Multiple floors per widget.
Map and Asset Map widgets show device positions and movement for trackers and outdoor assets. The Global Map shows the whole fleet and its geofences.
Math widgets calculate min, max, sum and average. Heat maps reveal patterns over time, Sankey diagrams show how energy or flows split, and tables compare many devices.
Downlink buttons, event lists, headers, images and markdown text turn a dashboard into an operator console with instructions built in.
The Floor Plan widget places readings and status overlays on your building layout, so a facility manager sees the warm room instead of reading a list of sensor IDs.
| Dashboard types | Asset dashboards (per template) and site dashboards (multi-device) |
|---|---|
| Live-value widgets | Gauge, Digital, Level, Boolean, Battery |
| Time-series widgets | Chart (line / bar), Log Chart, Scatter Plot |
| Spatial widgets | Floor Plan, Map, Asset Map, Global Map |
| Analytics widgets | Math, Table, Heat Map, Sankey, Report |
| Control & context | Downlink Button, Events, Header, Image, Markdown |
| Access | Role-based access with custom roles; Android mobile app |
| AI | AI agents can create and update dashboards through the MCP server |
No. Dashboards are built by adding widgets and choosing the device and data field in a form. Layouts are drag-and-drop.
An asset dashboard is defined on the asset template and shown for every device of that model. A site dashboard (formerly global dashboard) combines widgets from many devices, for example a whole building or fleet.
Yes. Upload an image of the floor, machine or site and place live values and coloured status areas on it. One widget can hold several floors.
Yes. The Downlink Button widget sends a predefined command to a device, on integrations that support downlinks.
Yes. Custom roles control which sections each user can open and can limit access to specific items, so customers or contractors see only their part.
Yes. The Widgelix mobile app for Android shows dashboards with tappable charts. An iOS version is coming.
Tell us what you monitor and who needs to see it. We'll show you dashboards for your devices and roles.