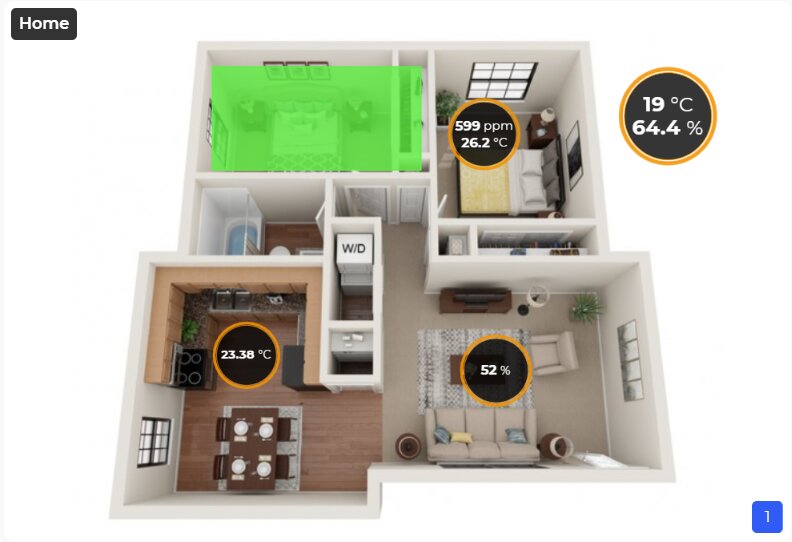
IoT floor plan dashboards: see sensors where they are
Upload the plan of each floor and place live readings and coloured status zones exactly where the sensors are installed. Facility teams see the warm room, the open door or the leak at a glance, without reading lists of device IDs.
Device lists don't tell you which room has the problem
A building with hundreds of sensors produces hundreds of rows. When the alert says “Sensor 117 humidity 78 %”, someone still has to work out where sensor 117 is. On a floor plan the answer is obvious.
Device names don't match room names
New staff don't know where sensors are installed
Problems are spotted late in long tables
Every building needs a custom visualisation
How it works
Three steps to a live floor plan
01
Add a floor
Add a Floor Plan widget to a site dashboard, click Add floor, name it, set the button label and upload the plan image (2D or 3D, up to 300 kB).
02
Place markers
Add circles or squares for status zones, or digital markers for live values. Pick the asset template, asset and data field, then drag and resize the marker on the plan.
03
Watch it update
Values and colours update as data arrives. Switch floors with the buttons in the corner of the widget.
Capabilities
Everything a floor plan needs
Floor plans are a widget on site dashboards, so they sit next to charts, tables and maps of the same building.
Status zones
Circle and square overlays switch colour by value: one colour and text when the value is true (above zero), another when it is false. Ideal for doors, leaks, occupancy or alarms.
Your own colours and labels for both states
Show or hide the text on the zone
Drag and resize to cover a room or area
Live values
Digital markers show up to two data fields, for example CO₂ and temperature, right on the room where the sensor is mounted.
Multiple floors
One widget can hold several floors. Each floor has a name and a button so viewers can switch between them.
Any image
Use architectural plans, 3D renders, photos of a machine or a production line. Anything you can draw a sensor position on.
Next to the rest of your data
Combine the floor plan with charts, tables, gauges and event lists on the same site dashboard.
Linked to Actions
The same data that colours the plan drives Actions, so an alert can follow the moment a zone turns red.
At a glance
Floor Plan widget
Where
Site dashboards (multi-asset dashboards)
Floors
Multiple per widget, each with a name and switch button
Image
2D or 3D image in any common format, up to 300 kB
Status zones
Circle and square, colour and text for true and false values
The Floor Plan widget is available on site dashboards, which combine data from many assets.
+What image can I use?
Any 2D or 3D image of a floor, building, machine or site, up to 300 kB per floor. Compress large plans before uploading.
+Can one widget show several floors?
Yes. Add as many floors as you need; each gets a name and a button to switch to it.
+How do coloured zones work?
A circle or square zone reads one data field. When the value is above zero it shows the “positive” colour and text, otherwise the “negative” colour and text. You choose both.