SolutionSmart Waste Monitoring

Empty bins when they're full. Not when the schedule says so.

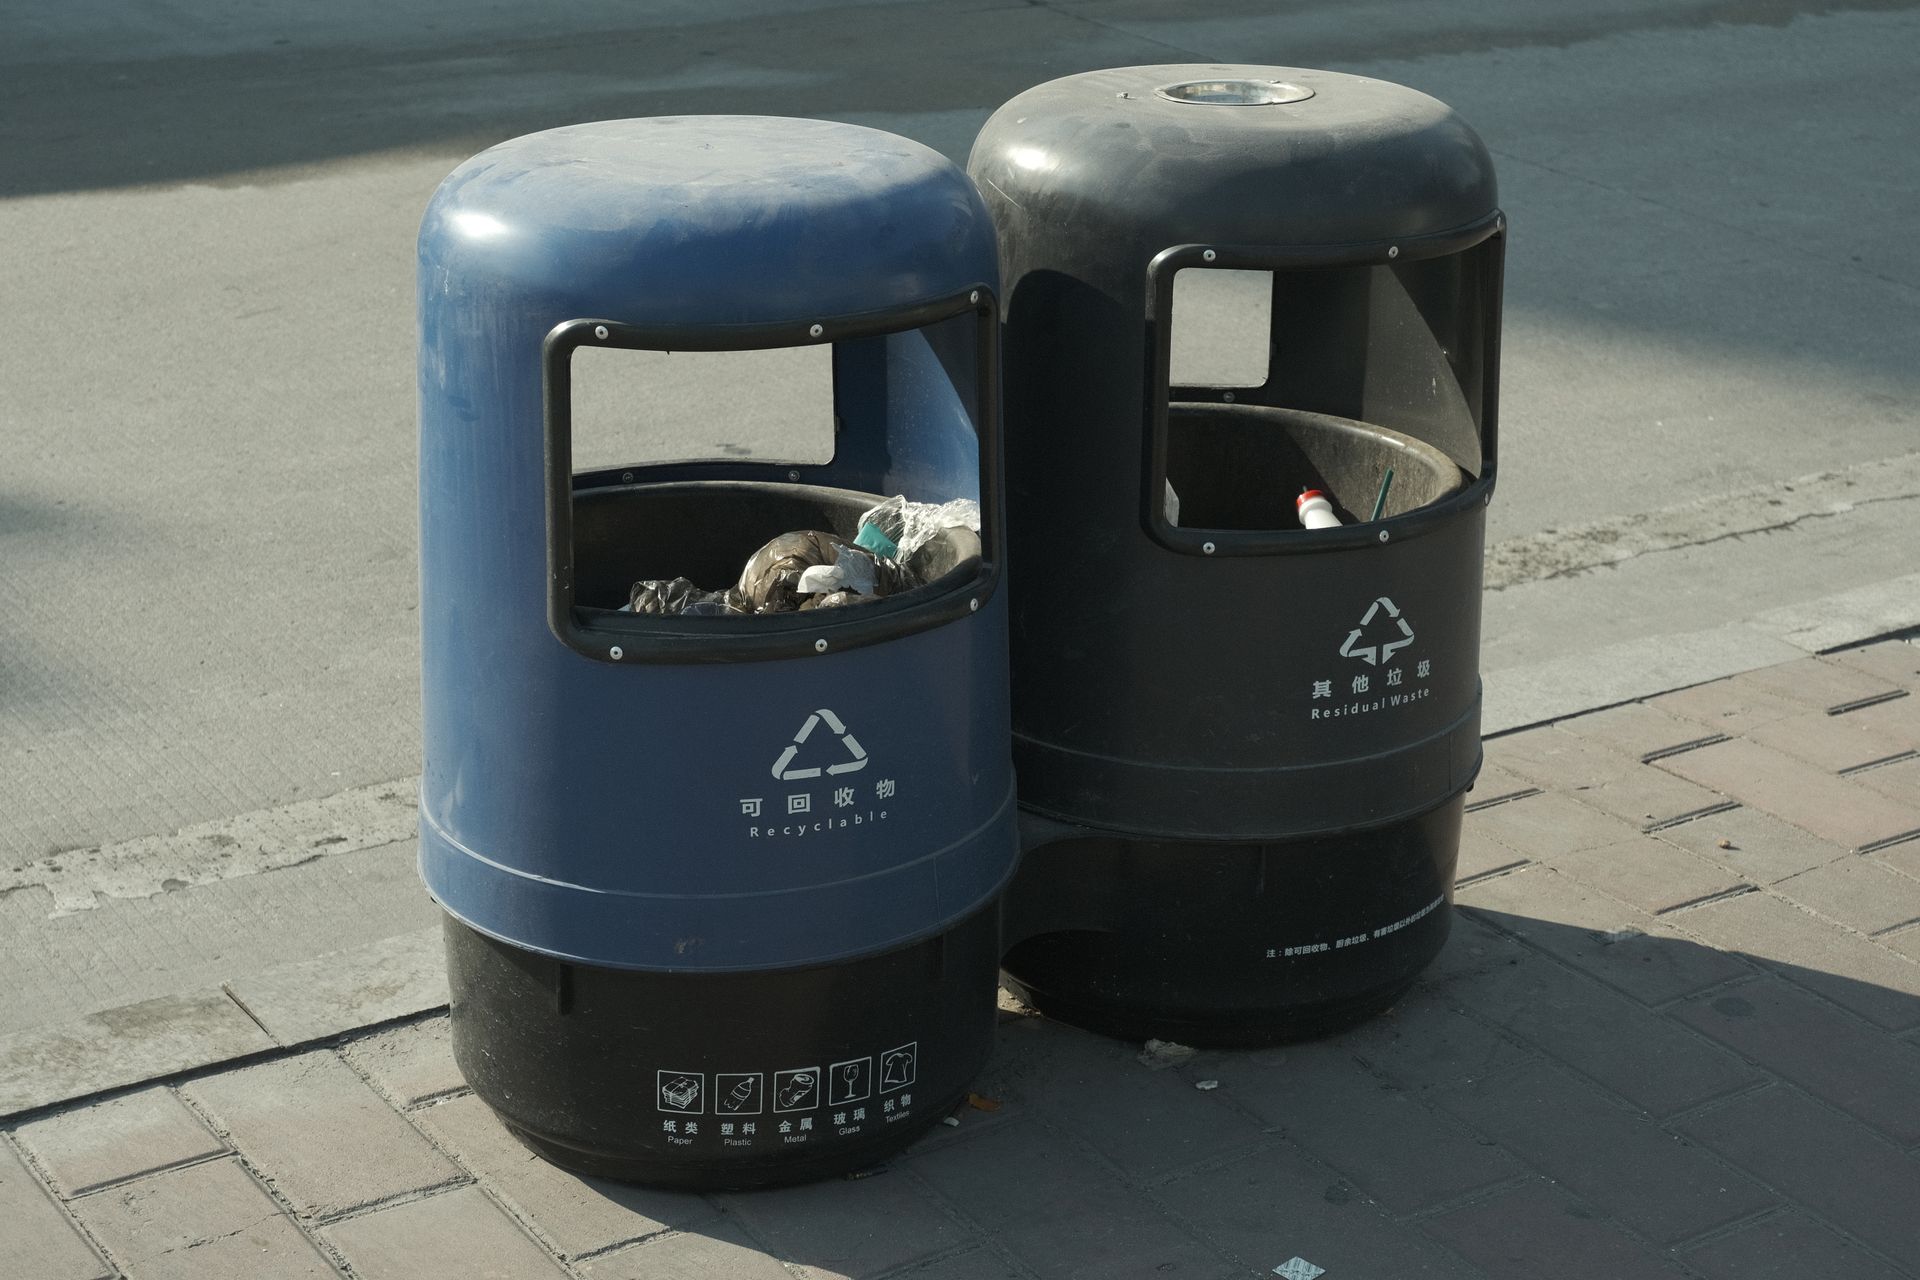
Widgelix monitors the fill level of every container in real time — street bins, underground containers, industrial skips — and turns collection from fixed routes into demand-driven operations. On your own LoRaWAN network, with an AI layer your team can simply ask.

Every bin, live
fill level, temperature, and last-emptied status per container
Demand-driven routes
collect what's full, skip what isn't
Your network
city-wide coverage on LoRaWAN infrastructure you own
Urban waste containers with fill-level monitoring overlay
Container 47 · Market Sq — 82% full, added to today's collection list
The problem

Fixed routes serve the schedule — not the city.

Most waste collection still works blind: trucks follow the same route on the same days, whatever is actually inside the bins. The result is waste in both directions — vehicles, fuel, and crew hours spent emptying half-full containers, while high-traffic spots overflow two days before the next visit and generate complaints, litter, and pests.

What goes wrong
Trucks emptying bins that are 30% full — paying full collection cost for a fraction of the load
Overflowing containers between scheduled visits — complaints, litter, and cleanup costs
No visibility into which locations fill fast and which never do
Routes planned by habit, not by data
Fuel, emissions, and crew hours spent driving past bins that didn't need a visit
Seasonal and event-driven spikes discovered only after the mess
/ How it works

From a sensor in the lid to a smarter route

01
Fill-level sensors in every container
Compact ultrasonic/laser distance sensors measure how full each bin is, with temperature sensing that can flag fire risk in containers. Battery-powered, built for years of unattended operation.
02
Data travels over your own LoRaWAN network
Bins across streets, parks, and districts report through the GreenMesh LoRaWAN Network Server; a handful of gateways cover a whole area.
03
Widgelix turns readings into status
Every container gets a live fill percentage, trend, and time-to-full estimate on dashboards and maps, portfolio-wide.
04
Rules trigger action
When a container crosses your threshold (say, 80%), it enters the collection queue and the team is notified; persistence logic ignores momentary sensor noise from a bag pressing the sensor.
05
Operations follow demand
Dispatchers see exactly which containers need service today; collection lists and alerts replace blanket routes. Every visit and level history is logged for planning and reporting.
Example rules

When any container passes 80% full — add it to today's collection list and notify the depot. If temperature inside a container spikes — alert immediately: possible fire.

Two rules, every bin in the city.

/ Your infrastructure

City-wide coverage on a network you own

Waste monitoring is a textbook LoRaWAN case: hundreds or thousands of battery sensors scattered across streets, courtyards, and underground containers — places with no power and no Wi-Fi. A few gateways cover an entire district, sensors run for years on a battery, and with the GreenMesh LoRaWAN Network Server the whole chain belongs to you: your gateways, your network, your data. No third-party network operator, no per-message fees, and no coverage promises you don't control.

Learn more about the GreenMesh LoRaWAN Network Server
A handful of gateways covers a district
Sensors run years on battery — no power, no Wi-Fi needed.
Works underground
Reliable in underground and semi-underground containers.
Multi-tenant separation
Run several municipalities or clients on one deployment.
Deployment your way
Cloud, private cloud, or on-premise — your policies decide.
/ AI Integration

Ask your city how full it is

Widgelix ships with a native MCP server, so AI assistants like ChatGPT and Claude connect directly to your waste data — and to the platform itself. Planning stops being a spreadsheet exercise and becomes a conversation:

The agent reads your fill-level history, spots the patterns, and answers in plain language — which locations to visit, which to skip, and where containers are over- or under-provisioned. With the right permissions, it can also set up alerts, tune thresholds, and build dashboards for a new district — from a conversation, not a console.

Which containers will likely be full by Friday?
Show me the ten fastest-filling locations this month.
Compare fill patterns before and after the new schedule.
Which bins haven't needed collection in 30 days — can we remove them?
Fourteen containers are on track to pass 80% by Friday — nine of them around Market Square, which has filled twice as fast since the weekend fair started. I've listed them for Thursday's run.
/ Capabilities

A complete waste operations layer

Live map & dashboards
Every container's fill level, trend, and history on a map view your dispatchers actually use.
Collection queues & alerts
Threshold-based lists of what needs service today, delivered to email, SMS, or your systems via webhook.
Fire-risk alerting
Temperature spikes inside containers trigger immediate alerts.
Fill analytics & right-sizing
See which locations overflow, which stand idle, and where containers should be added, removed, or resized.
Scheduled reports
Collection statistics and level histories delivered automatically to management and municipal clients.
Hardware-agnostic & white-label
Mix fill-level sensor vendors freely, and deliver the whole service under your own brand.
/ Good fit for

Wherever bins fill up

Municipalities and public waste services
Private waste-collection operators
Shopping centres and retail parks
Campuses, airports, and transport hubs
Residential complexes and housing operators
Industrial sites with skips and containers
Integrators building smart-city services for their clients

Stop driving to bins that don't need you.

Tell us about your operation — how many containers, what kinds, and how you collect today. We'll show you how fill-level monitoring on your own LoRaWAN network turns fixed routes into demand-driven collection, with the data to prove the difference.

  • A container-by-container monitoring plan for your area
  • The right sensor types per container class — street, underground, industrial
  • Network design: gateways, coverage, and deployment model
Book a Demo

We'll map a container-by-container monitoring plan to your area.